📈Chartpack: Retention and Churn Rates - Part 2
Comparing churn across industries, product verticals and devices
🔒Chartpacks are in-depth analysis of the data and trends you need to help you make stronger strategic decisions. These product-focused insights will broaden your perspective beyond your immediate environment.
If you’d like to unlock your newsletter to receive them you can do so below. Or you can find out more about what you get as a paid subscriber here.
Hi product people 👋,
If you’ve worked in a SaaS or subscription business you’ll know that one of the most critical metrics to measure to monitor the health of your product is churn and retention. But since many companies don’t reveal their retention figures or choose to keep them hidden away in a company earnings call transcript, understanding how your product’s retention and churn rates compare to competitors can be difficult.
That’s why in this Chartpack, we’re going to take a look at retention and churn rates in 2024 to help you contextualise your own product’s performance.
We’ll explore retention and churn at an industry level for B2B and B2C and we’ll also take a look at the performance of specific products like Netflix, Atlassian, Adobe, HelloFresh and others.
Coming up:
Industry churn and retention benchmarks - is 2024 looking better than previous years so far?
B2B product spotlight: how Atlassian, Salesforce, Adobe retention rates compared
B2C product retention and churn analysis across different markets: Netflix and streaming services, Mealkit delivery, fitness
How to reduce churn by increasing the cost of switching
Mobile apps: retention on iOS and Android compared
PS, if you missed some of our previous Chartpacks you can find some related posts here:
Industry retention and churn rates
Before we dig into the data, it’s worth noting that there are multiple ways of reporting churn and retention, including net dollar retention rates or gross dollar retention rates. In this chartpack we’re mostly focusing on customer churn and retention as opposed to net dollar retention rates, which is something slightly different.
Here’s what the latest churn rates look like across various industries:
One of the most effective way of measuring retention and churn rates across the SaaS industry is to use tools which integrate with SaaS payments since they have the raw, accurate data of how many customers are paying or cancelling their subscriptions to SaaS products.
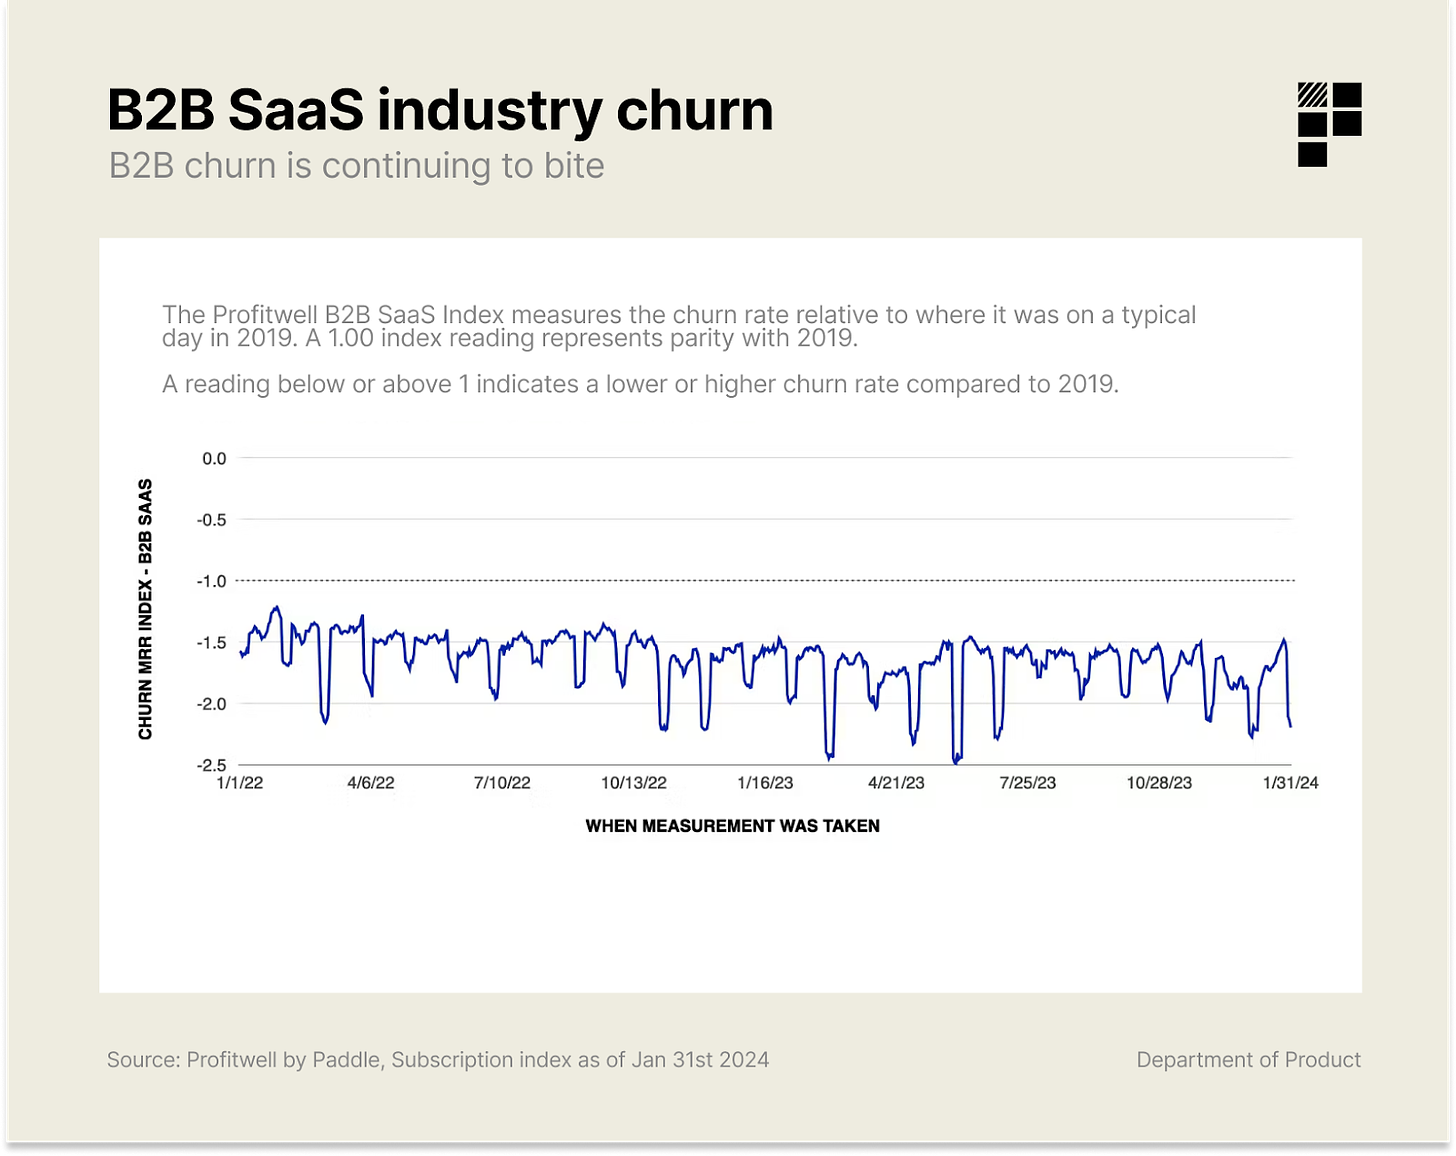
The Profitwell B2B SaaS index measures churn at an industry level with data from over 34,000 companies.
Here’s how companies are currently performing in Q1 2024:
The index you’re looking at here is a measurement of churn performance relative to the same period in 2019. An index of 1 means performance is on par with 2019 and anything above or below is relative to the 2019 figure.
As you can see, in December, B2B churn reached an all time high in December 2023 and there was almost no change in January. At the end of the month the index recorded an average of -1.84 (slightly better than the -1.85 in December) but still up year on year vs January 2023.
December is understandably a month where many companies are assessing their annual budgets or when annual contracts expire so an increase in churn is to be expected to some extent. But so far this year, churn rates haven’t improved for B2B SaaS.
For B2C, the Profitwell index report compares performance against 2022 and it concludes that B2C churn improved marginally in January, ending on an average index of 1.02.
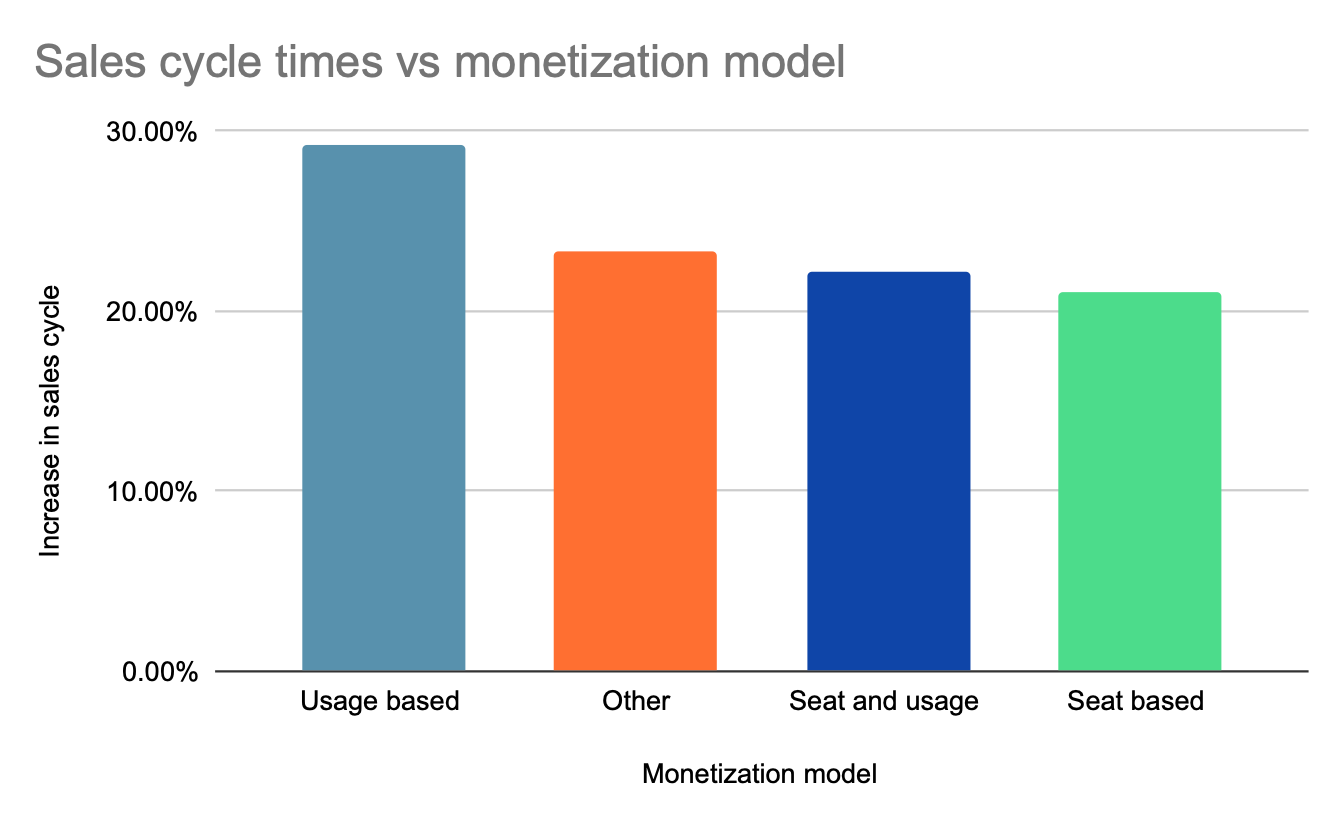
Despite challenges in churn, one factor to consider that is likely to be impacting overall revenues is the increase in the amount of time it takes to close a new sale for SaaS companies. In this analysis by VC Tomasz Tunguz, he reports that sales cycle times shifted dramatically in 2023, slowing down for most businesses. The average startup saw a 24% increase in sales cycle, with enterprise businesses slowing down the most:
What’s also interesting is that the monetization type also seems to impact the sales cycle. And perhaps unsurprisingly, usage-based pricing saw the greatest increase in sales cycle time:
B2B product spotlight
So that gives us a sense of what the picture looks like at an industry-level. Now let’s take a closer look at some specific products’ performances across both B2B and B2C to help you benchmark you own product’s performance. We’ve hand picked a selection of different products including Atlassian, Salesforce, Netflix, Peloton and others.
Atlassian
In their most recent earnings call, Atlassian confirmed that churn continued to be less than they expected. CFO Joseph Binz said:


