📈 Chartpack: SaaS product benchmarks
CAC, growth, net dollar retention and other metrics to help you contextualise your product’s performance
🔒Chartpacks are in-depth analysis of the data and trends you need to help you make stronger strategic decisions. If you’d like to upgrade to receive them you can do so below. Or you can find out more about paid access here.
Hi product people 👋,
In today’s chartpack, we’re taking a deep dive into the state of SaaS in 2023 so that you can compare your product’s own performance against some industry-wide benchmarks.
This is the latest data available from several sources which includes survey data from over 3,500 global SaaS companies commissioned by payments startup Paddle, VC firm OpenView and publicly available information for listed companies.
If you work at a SaaS company, these insights should help you to contextualise your own data points, but even if you don’t, having an understanding of the landscape and some of the challenges faced by companies in 2023 is still important.
Coming up:
Revenues, growth - what does growth look like in SaaS in 2023?
Profitability - how are product-led companies achieving profitability?
Customer acquisition costs and net dollar retention
Team composition - what roles does a typical SaaS company have and how does this change as it scales?
Growth rates
Perhaps unsurprisingly, growth rates have stalled significantly over the past few years. The pandemic boom years of 2021 saw growth rates of 60-100%+ for many companies but if we look at industry averages across the board, quarterly growth in SaaS is lagging at around 10%.
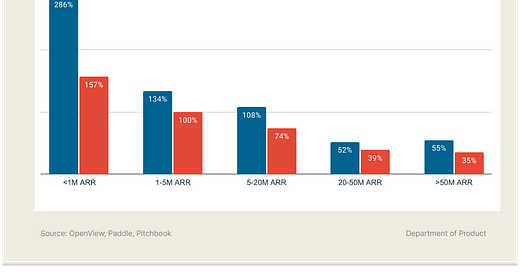
When we look exclusively at the top percentile of companies surveyed, growth is impressive but is still significantly down when compared against 2023. Segmented by annual recurring revenues (ARR), smaller SaaS companies appear to be hit worst with larger businesses still down but larger business growth has plateaued to around 35% - summary here:
<$1M ARR: from 286% to 157%
$1-5M ARR: from 134% to 100%
$5-20M ARR: from 108% to 74%
$20-50M ARR: from 52% to 39%
There are signs that the decline in growth is now stabilizing, with Q2 '23 overall growth back up to 10.40%, but product teams will be hoping that as the self-proclaimed "year of efficiency" that many tech companies have declared comes to an end, we'll see growth rebound next year.
The push for profitability
With cost-cutting measures rampant throughout the tech industry and high interest rates burdening the economy, product teams at loss making tech companies have found themselves scrambling to focus on finding a path to profitability.
Here’s the percentage of SaaS companies that are break-even or profitable:
Just 7% of high growth SaaS companies with more than $20m ARR are break even or profitable but 41% of slower growth companies in the same ARR category are break even or profitable. This makes sense as fuelling growth often comes at a cost as businesses spend more to attract customers and focus on profitability later.
Profitability, on the other hand, can often mean a mix of cutting costs, cutting staff, reducing marketing budgets and increasing prices to squeeze as much revenue as possible from existing customers.


